

Online Dashboard Creator - Visualize Your Data in Minutes
Our streamlined dashboard creation process empowers you to effortlessly generate captivating charts that effectively display all pertinent information regarding the performance of your strategies. In essence, contemporary online dashboards serve as robust tools that enable you to proficiently monitor your business's daily operations, serving as a convenient, easily digestible one-page summary of the data analysis or key metrics you have spearheaded. They offer a user-friendly overview of your work that can be effortlessly shared with anyone you desire. In addition to these advantages, Onvo's business intelligence dashboards provide an array of unparalleled features:
Encourage collaboration: Share dashboards and reports with your colleagues according to your preferences - you have complete control over your information and can select what you want to display.
Work remotely with ease: Experience the flexibility of working from anywhere, on any device through a web interface. Our on-demand BI tool simplifies the process, requiring only a sign-in to your Onvo account.
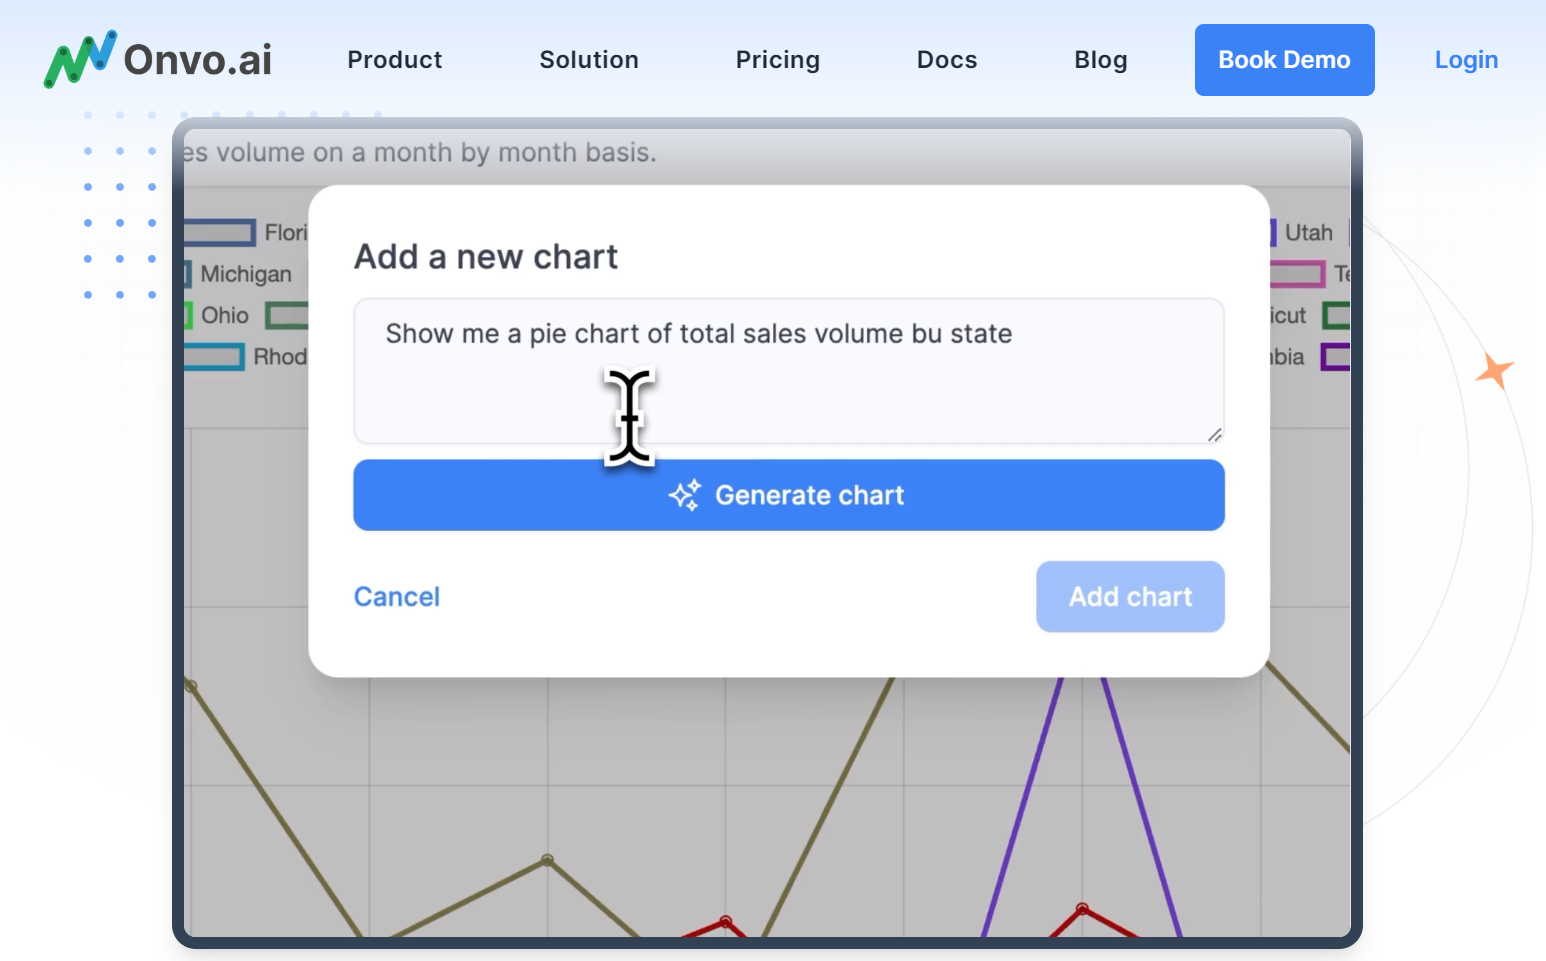
Leverage an intuitive drag-and-drop interface: Onvo's dashboard generator empowers you to effortlessly create impressive charts and dashboards without the need for extensive IT expertise. Just select the data you want to integrate and effortlessly drop it into the designated field – let the software handle the rest.
Embrace the power of dynamic data: The true strength of a dashboard maker is its ability to create interactive experiences. With the assistance of professional dashboards, you can move away from static PowerPoint slides and instead utilize an engaging interactive dashboard that enables you to showcase all your analysis results on a single screen. This interactive functionality empowers you to easily filter and customize the displayed information according to the specific discussion points you want to highlight.
Effortlessly explore your data: Onvo's advanced dashboard creator empowers you to seamlessly integrate multiple interactive filters into your graphs and charts. This enables you to delve deeper into your data, confidently addressing any questions that may arise.
Effortlessly create real-time dashboards: With automatic synchronization, you can stay up to date without the need for constant manual updates of your data sources. Additionally, our smart data alerts will promptly notify you of any business anomalies, ensuring you are always in the know.
Streamline your data management: Seamlessly connect all your databases to a central point and efficiently consolidate your data in one secure location. Harness the power of cross-database queries to gain comprehensive insights. With user-friendly data connectors, you can effortlessly access all your vital business information from a single, centralized access point.
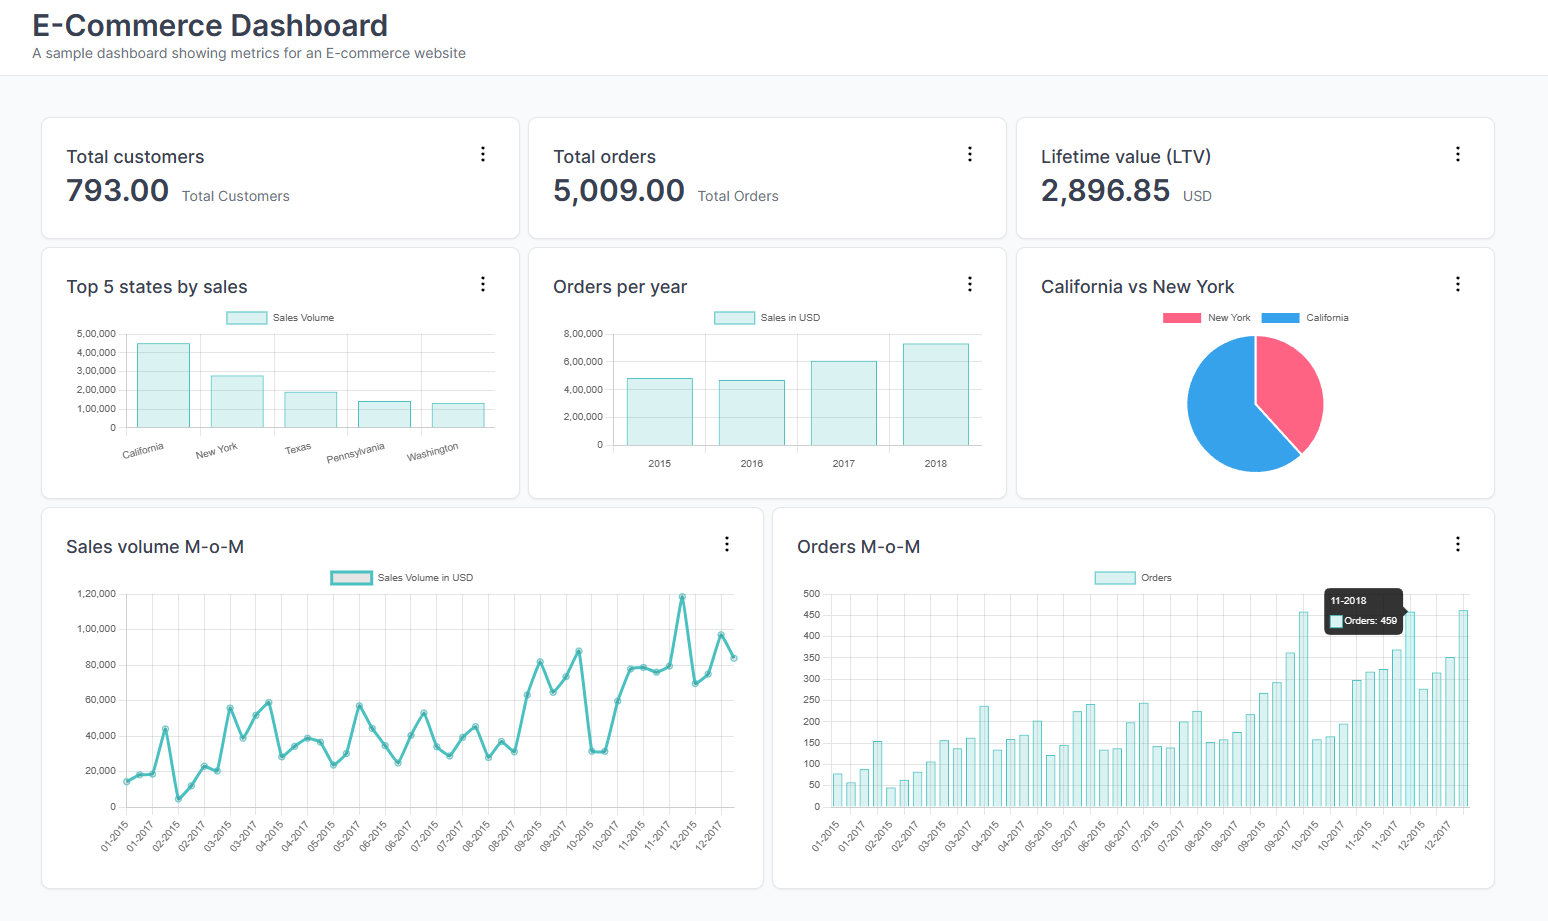
Stay on top of the metrics that truly matter: Stay vigilant and keep a close eye on the key metrics that drive value for your business. By carefully selecting the most relevant KPIs, you will be able to quickly identify any significant shifts at both the operational and strategic levels. Explore our collection of business dashboard examples for a comprehensive overview of the various possibilities for monitoring your business.
Advantage of an optional advanced SQL Query Box: This feature of our online SQL query builder allows advanced users, such as IT specialists, data analysts, or data scientists, to manually input SQL code. With this capability, you can extract the most valuable insights from your analyses with confidence and precision.
Enhance your dashboards: Not only can you effortlessly create impressive dashboards with just a few clicks, but you also have the power to customize them based on your brand or client's identity, adding a professional touch.
Effortless dashboard generation: With Onvo, you can confidently leave behind the tedious task of creating a dashboard report. Our tool empowers users to effortlessly generate dashboards online and share them within minutes. This allows you to allocate more time towards tackling other crucial analytical tasks.
Maximize device flexibility: As stated earlier, our dashboard maker empowers users to effortlessly access their data from any device connected to the internet. What's even more impressive is that your dashboards automatically adjust to fit the screen size they are displayed on. This ensures a seamless and comprehensible analysis experience.
Guarantee your outcomes: Unlike any other BI dashboard software available in the market, Onvo's online dashboard creator empowers you with user-friendly predictive analytics features that leverage historical data to accurately forecast future results in your data. This robust functionality allows you to thoroughly analyze the past and establish future objectives based on reliable projections.
For our experienced users, we also provide advanced chart options. With Onvo's dashboard creator software, you can easily add a secondary axis to your chart. Imagine you want to create a report displaying the monthly growth of customers and total revenue generated. Instead of creating separate charts for revenue and number of customers, you can combine both datasets and incorporate a secondary axis. This allows you to visualize two values on a single chart, even with a large range of data, which would not be easily noticeable with just one axis. Presenting two types of data on a single chart is an effective way to display correlations that your audience will quickly understand.
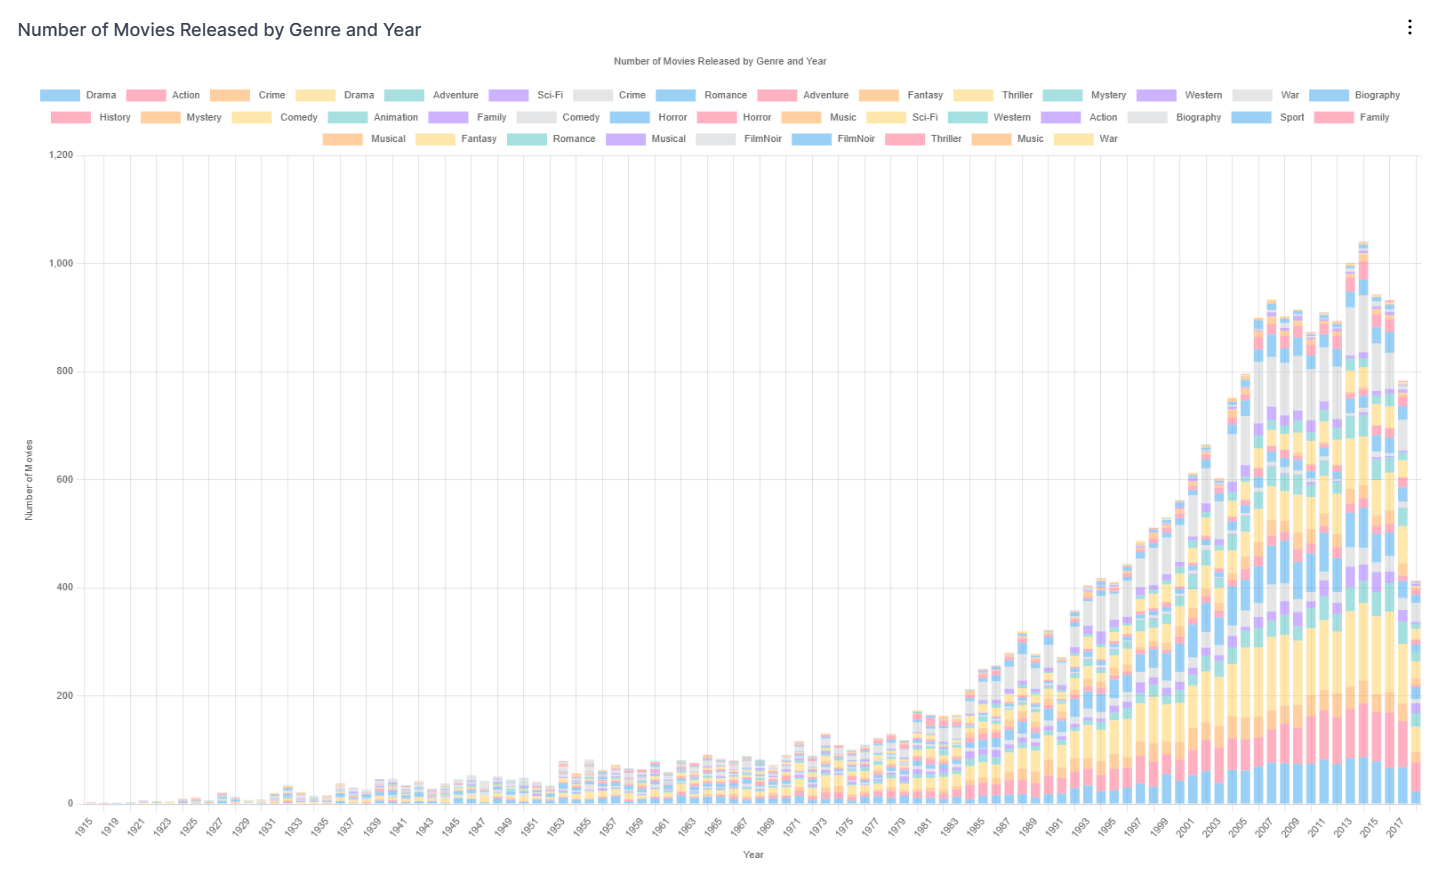
Our powerful dashboard generator also allows you to effortlessly combine various chart types within a single chart with just a single click. Using the example provided above, let's say you typically present your monthly customer growth and total revenue as a bar chart. If you wish to switch the style and showcase the data as a line chart instead, you can instantly do so with the assistance of our state-of-the-art dashboard maker. We firmly believe that you should have full control over the visual impact of your charts, which is why we have made it incredibly convenient for you to make changes with just one click. In order to cater to all your data visualization requirements, we provide an extensive selection of over 30 distinct types of charts and graphs within Onvo. Feel confident in creating visually stunning and impactful presentations with ease.
Designed for not only advanced users, but also for typical business users in small companies or large enterprises, managers, c-level executives, or departmental employees, these interactive dashboards empower you to effortlessly manipulate large volumes of data. Once you connect your data sources, you can easily select one of our dashboard templates or create your own. Another option is to request a POC, a seamless way to obtain your personalized dashboard in a product demo after you submit your data and specific requirements. The beauty of these dashboards not only lies in their carefully crafted interface, but also in their robust engine that drives sustainable business growth confidently.
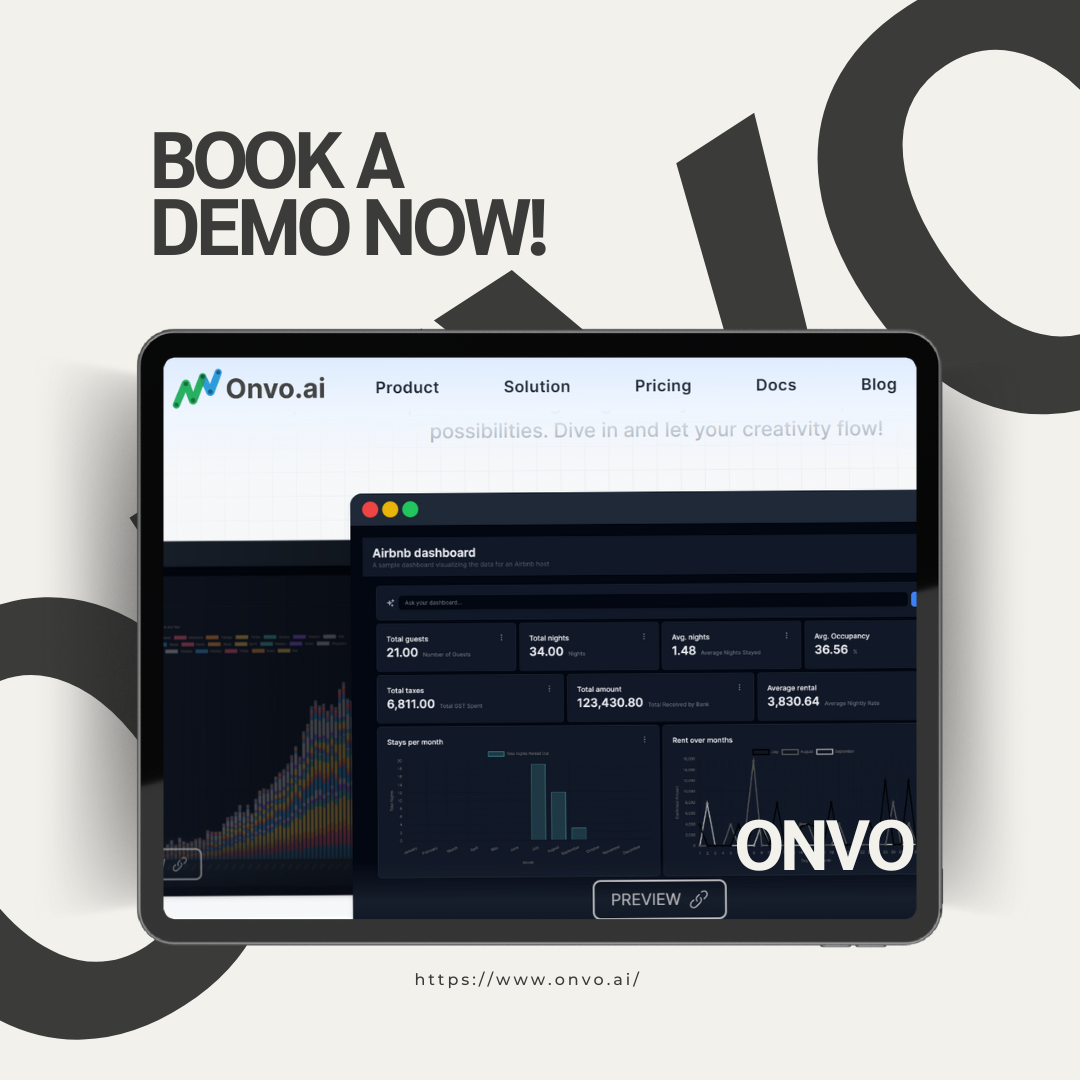
Ready to Dive In?
If you're intrigued by the possibilities of AI-powered data visualization, we invite you to explore further. Visit our website for more information or book a call with us to discover how Onvo can revolutionize your data-driven decision-making.